The csa API
-
class
pygridgen.csa.CSA(xin, yin, zin, sigma=None, npmin=3, npmax=40, k=140, nppc=5)[source]¶ Bases:
objectCubic spline approximation for re-gridding 2D data sets
- Parameters
- xinarray-like
an array of x data point locations
- yinarray-like
an array of z data point locations
- zinarray-like
an array of z data point locations
- sigmaarray-like or None
an array of errors for zin (standard deviation) None for no error (default)
- kinteger
Set the spline sensitivity (default = 140). Reduce to get smoother results.
- nppcinteger
Average number of points per cell (default = 5) Decrease to get smaller cells or increase to get larger cells
- npmininteger
Minimal number of points locally involved in spline calculation (default = 3)
- npmaxinteger
Maximum number of points locally involved in spline calculation (default = 40)
- Returns
- csa_interpobject
This object can be called with arguments of x and y points to be interpolated to. The input data, zin, can be reset by overwriting that object parameter.
Examples
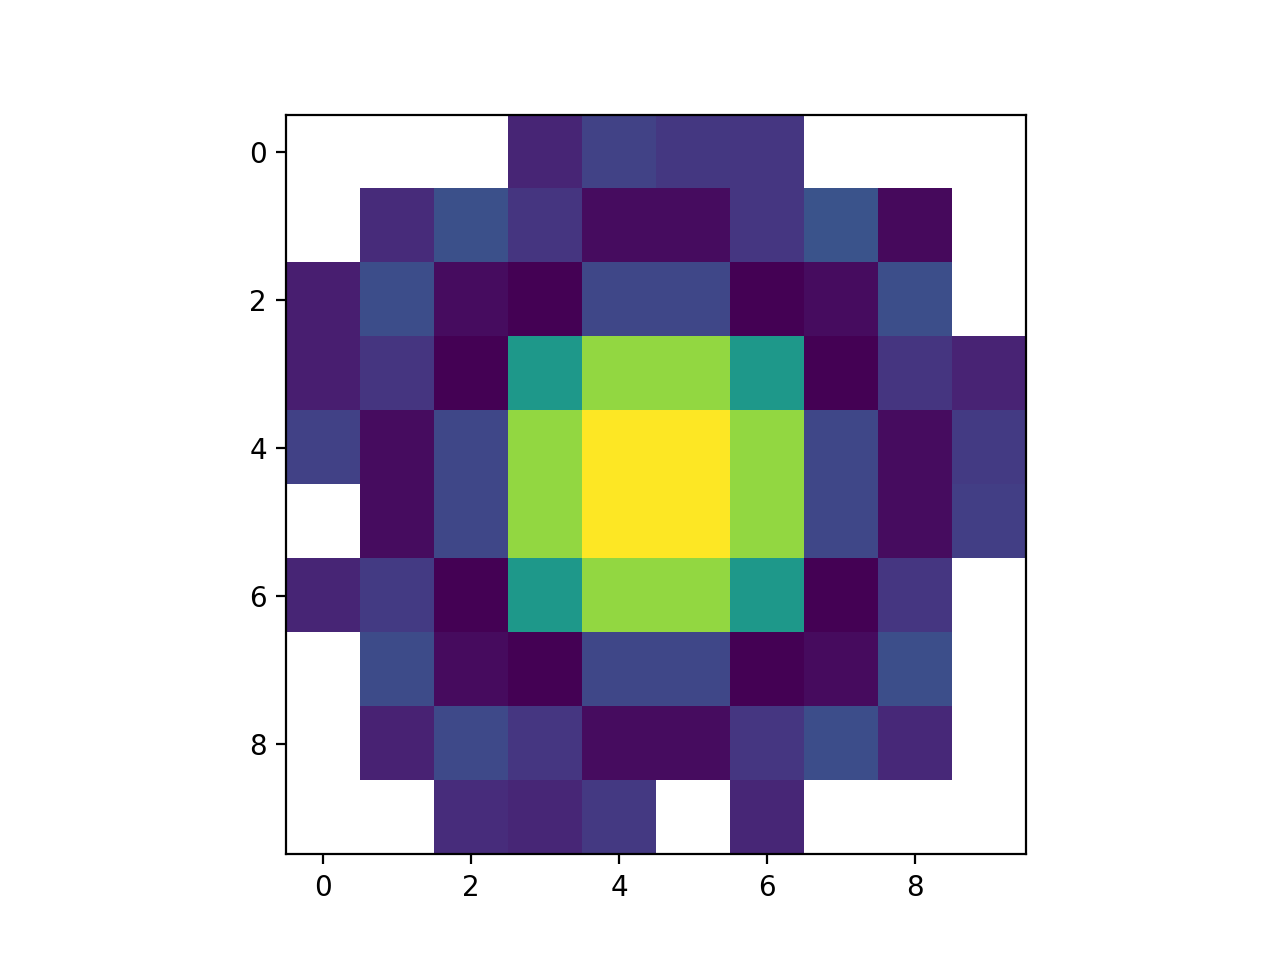
import numpy as np
import matplotlib.pyplot as plt
from pygridgen import csa
xin = np.random.randn(10000)
yin = np.random.randn(10000)
zin = np.sin( xin**2 + yin**2 ) / (xin**2 + yin**2 )
xout, yout = np.mgrid[-3:3:10j, -3:3:10j]
csa_interp = csa.CSA(xin, yin, zin)
zout = csa_interp(xout, yout)
img = plt.imshow(zout)
(Source code, png, hires.png, pdf)

-
property
zin¶ Input values to be approximated
-
name= 'libcsa.so'
-
path= '/home/docs/checkouts/readthedocs.org/user_builds/pygridgen/conda/latest/lib'
-
plot(xout, yout, ax=None, mesh_opts=None, scatter_opts=None)[source]¶ Plot the input and output data set from the cubic split approximation.
- Parameters
- xout, youtarray-like
Two-dimensional arrays of x/y coordinates at which
zoutshould be estimated.- axmatplotlib Axes, optional
The axes on which the plot should be drawn. If not provided, a new axes and figure will be created.
- mesh_opts, scatter_optsdict, optional
Dictionary of plotting options passed to matplotlib’s pcolormesh and scatter functions, respectively.
- Returns
- axmatplotlib Axes.